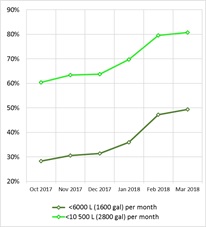
 Graph showing percent of Cape Town houses using less than 10 500 and 6000 litres per month - © city of Cape Town
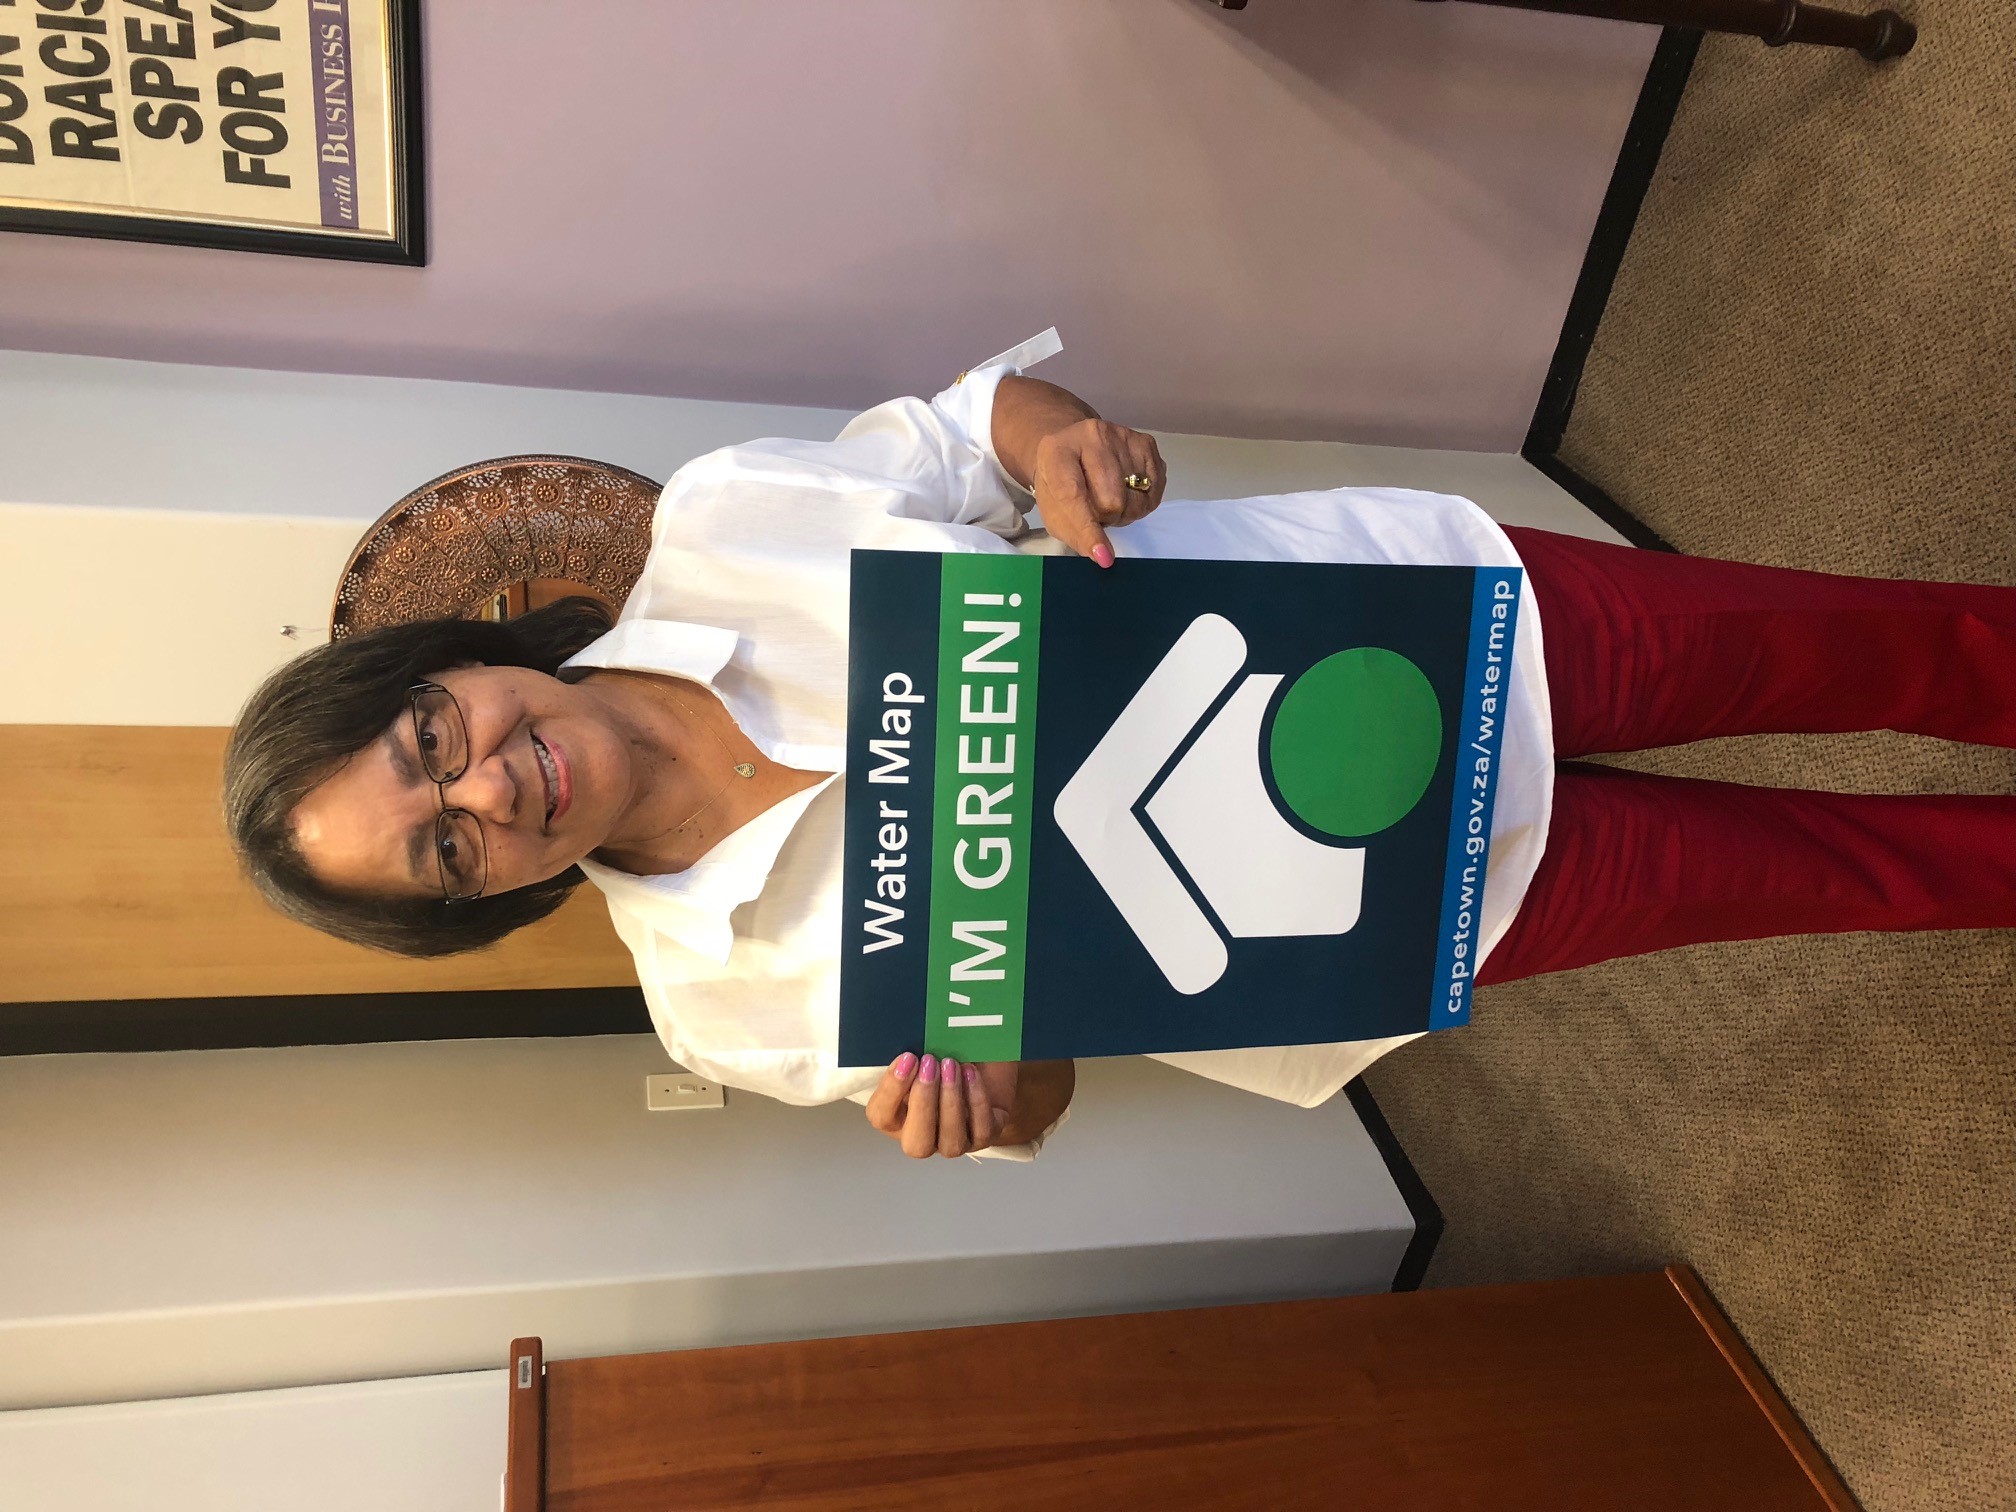 City of Cape Town executive mayor Patricia de Lille holding a poster “Water Map – I’m Green!” - © city of Cape Town
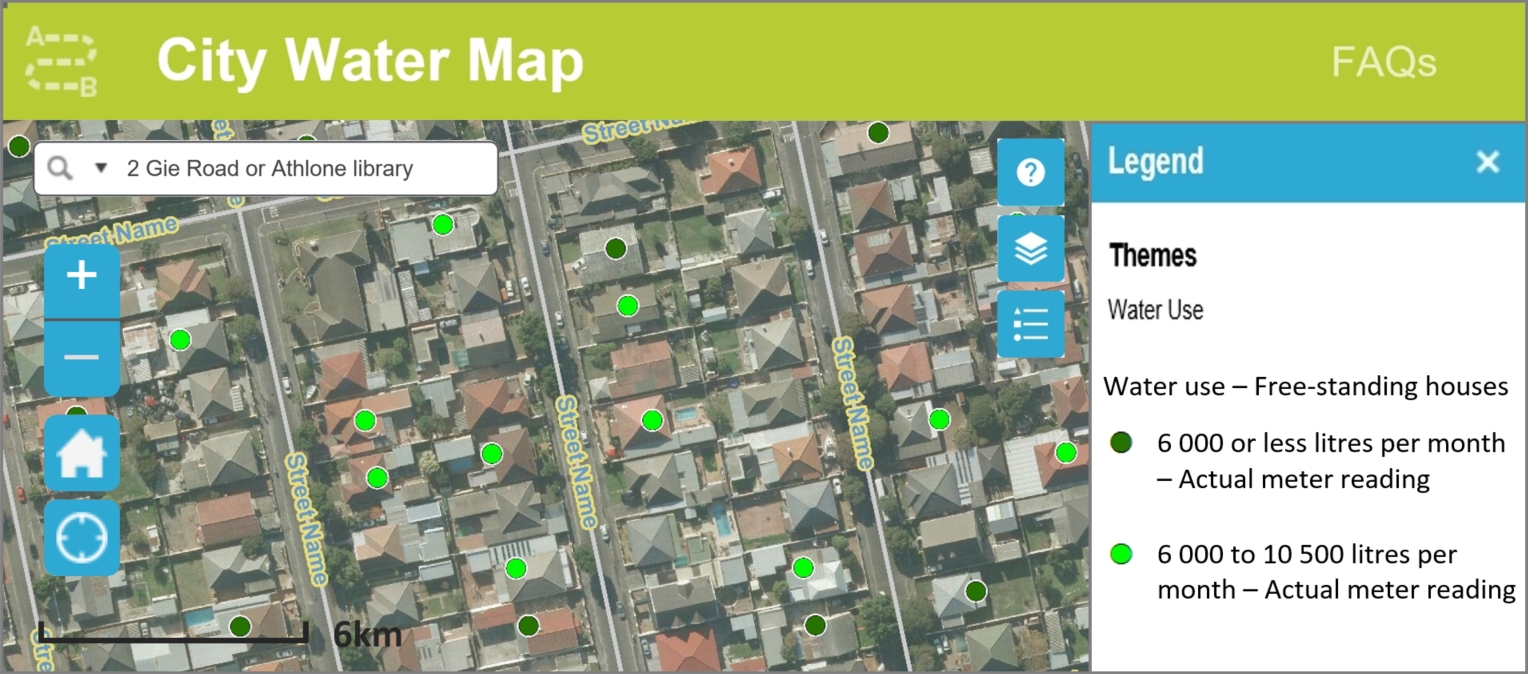
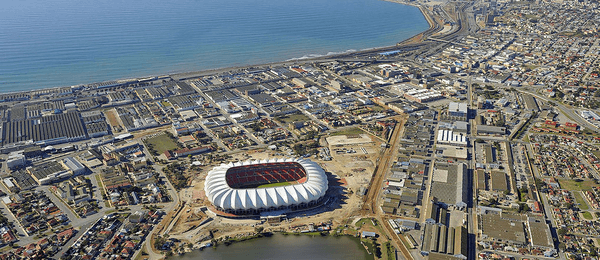
 City of Cape Town’s Water Map, South Africa - © city of Cape Town
Item 1 of 3
Status
ongoing
50%
City
Cape Town
Main actors
City Government, Community / Citizen Group, Research Institutes / Universities
Project area
Metropolitan Area
Duration
Ongoing since 2018
The Cape Town Water Map is a novel behaviour-change tool that helped reduce water use during the extreme drought experienced in Cape Town from 2015-2018.
The City of Cape Town launched an innovative water conservation initiative known as the Cape Town Water Map in 2018. The aim of the map was to encourage residents to dramatically reduce water consumption in compliance with the stringent water restrictions implemented by the city as part of its “Avoid Day Zero” strategy during a severe drought that had started 2015.
The map and related media campaign publicly acknowledges households that are achieving water-saving targets on an online map. Water-saving households are “rewarded” with colour-coded symbols displayed on their properties in order to incentivise and normalize water-saving behavior. To our knowledge, this is the first time such as water conservation tool has been used.
Following its launch in January 2018, the Water Map experienced some of the highest internet traffic ever experience by a City of Cape Town webpage, it was widely reported on in the local media and received much attention on social media. The Water Map thus achieved substantial water conservation awareness and is believed to have contributed to the dramatic reductions in domestic water use which prevented the City from running out of water, the so-called “Day Zero”.
City to City Barcelona FAD Award
This project was shortlisted for the 'City to City Barcelona FAD Award' in 2018.
External links / documents
City of Cape Town, Water Map viewerCity of Cape Town’s Water Map, Journal of American Water Works Association, September 2018City of Cape Town, 15 January 2018, Press Release: Let’s paint this city greenCity of Cape Town, 27 June 2018, Press Release: Cape Town achieves record number of green dot households in May
On Map
The Map will be displayed after accepting cookie policy
Want to know more about this project?

Photo gallery